
To Learn More, Be Sure to Visit - oceancityfinancialgroup.com
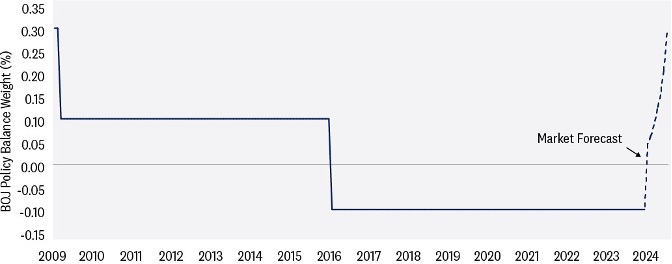
Jeffrey Roach, Ph.D., Chief Economist Lawrence Gillum, CFA, Chief Fixed Income Strategist It seems like we just can’t stop talking about central banks. And this week will be no different, with at least 15 central bank meetings planned, some more important than others, of course. While the Federal Reserve (Fed) meeting will likely take top billing in the financial media, it’s the Bank of Japan (BOJ) meeting on Tuesday that could be the real game changer. With inflationary pressures still above target in Japan, the BOJ may finally be ready to take interest rates out of negative territory for the first time since 2016. If true, the era of free money will finally be over, which could have an impact on U.S. markets.
Central bankers from the U.S. to Australia and seemingly everywhere in between will be meeting this week to discuss monetary policy. A total of 15 meetings will take place this week, highlighted by the Fed, the Bank of England (BOE) and the BOJ. After years of central banks tightening monetary policy by raising interest rates, markets (and consumers) are waiting for interest rates to come back down. Unfortunately, despite falling inflationary pressures, it may be a few more months until central bankers are ready to start lowering interest rates. That doesn’t mean these meetings won’t be worth watching; we think they will be, especially the Fed and BOJ meetings.
It seems like we just can’t stop talking about central banks. And this week will be no different, with at least 15 central bank meetings planned, some more important than others, of course. While the Federal Reserve (Fed) meeting will likely take top billing in the financial media, it’s the Bank of Japan (BOJ) meeting on Tuesday that could be the real game changer. With inflationary pressures still above target in Japan, the BOJ may finally be ready to take interest rates out of negative territory for the first time since 2016. If true, the era of free money will finally be over, which could have an impact on U.S. markets.
Central bankers from the U.S. to Australia and seemingly everywhere in between will be meeting this week to discuss monetary policy. A total of 15 meetings will take place this week, highlighted by the Fed, the Bank of England (BOE) and the BOJ. After years of central banks tightening monetary policy by raising interest rates, markets (and consumers) are waiting for interest rates to come back down. Unfortunately, despite falling inflationary pressures, it may be a few more months until central bankers are ready to start lowering interest rates. That doesn’t mean these meetings won’t be worth watching; we think they will be, especially the Fed and BOJ meetings.
 Source: LPL Research, Bloomberg, 03/13/24
Past performance is no guarantee of future results.
Economic forecasts set forth may not develop as predicted and are subject to change.
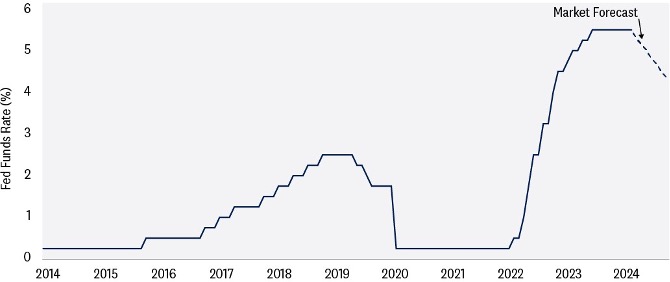
Along with the interest rate decision, the Fed updates its Summary of Economic Projections (SEP) four times a year, which is the Fed’s expectations on inflation and economic growth. With general softening of economic data (although still resilient), but perhaps stickier inflation than expected, markets will certainly be paying attention to the Fed’s forecast on economic growth, inflation, and unemployment.
BEWARE OF THE DOTS
Along with the SEP, the Fed releases its “dot plot”, which represents the expected path of short- term interest rates by Fed members. Each dot represents a member’s opinion on where the Fed funds policy rate should be over the next few years. While not official policy, it does provide additional transparency into Fed member thinking — albeit anonymously.
In December, which was the last time the dot plot was released, the Fed, in aggregate, expected three rate cuts in 2024; however, the opinions of individual members ranged from no cuts to six cuts. So, while the “median” member expected three cuts, it would only take two members (out of 17) to change their view to reflect only two expected cuts in 2024.
Our view: The stickiness of services inflation will likely push out the first rate cut. We’ve always thought the markets were overly zealous in thinking the Fed would cut six or seven times this year. The Fed communicated three cuts, and we expect three or four rate cuts this year as well.
However, historically, the Fed hardly ever does what it says, as evidence that dot plots are poor predictors of future Fed policy is clear.
The first rate cut will now probably come in June, unless something drastic happens domestically or abroad. Labor markets are stable, consumers keep spending, and geopolitical tensions are managed enough for the Fed to have lingering concerns about price stability.
After the Fed’s embarrassing mistake of keeping rates too low for too long and capital markets still reeling from the effects of that mistake, the Fed will not be inclined to make a similar misstep of cutting rates too soon.
Source: LPL Research, Bloomberg, 03/13/24
Past performance is no guarantee of future results.
Economic forecasts set forth may not develop as predicted and are subject to change.
Along with the interest rate decision, the Fed updates its Summary of Economic Projections (SEP) four times a year, which is the Fed’s expectations on inflation and economic growth. With general softening of economic data (although still resilient), but perhaps stickier inflation than expected, markets will certainly be paying attention to the Fed’s forecast on economic growth, inflation, and unemployment.
BEWARE OF THE DOTS
Along with the SEP, the Fed releases its “dot plot”, which represents the expected path of short- term interest rates by Fed members. Each dot represents a member’s opinion on where the Fed funds policy rate should be over the next few years. While not official policy, it does provide additional transparency into Fed member thinking — albeit anonymously.
In December, which was the last time the dot plot was released, the Fed, in aggregate, expected three rate cuts in 2024; however, the opinions of individual members ranged from no cuts to six cuts. So, while the “median” member expected three cuts, it would only take two members (out of 17) to change their view to reflect only two expected cuts in 2024.
Our view: The stickiness of services inflation will likely push out the first rate cut. We’ve always thought the markets were overly zealous in thinking the Fed would cut six or seven times this year. The Fed communicated three cuts, and we expect three or four rate cuts this year as well.
However, historically, the Fed hardly ever does what it says, as evidence that dot plots are poor predictors of future Fed policy is clear.
The first rate cut will now probably come in June, unless something drastic happens domestically or abroad. Labor markets are stable, consumers keep spending, and geopolitical tensions are managed enough for the Fed to have lingering concerns about price stability.
After the Fed’s embarrassing mistake of keeping rates too low for too long and capital markets still reeling from the effects of that mistake, the Fed will not be inclined to make a similar misstep of cutting rates too soon.
 Source: LPL Research, Bloomberg, 03/13/24
Past performance is no guarantee of future results.
Economic forecasts set forth may not develop as predicted and are subject to change.
Moreover, upon exiting its negative rate policy, according to Reuters, the BOJ will also ditch its bond yield curve control and discontinue purchases of risky assets such as exchange-traded funds (ETF), putting a formal end to the most aggressive monetary accommodation of former Governor Haruhiko Kuroda, which has been in place since 2013. To borrow a phrase from Bob Dylan, the times, they are a-changin’.
Source: LPL Research, Bloomberg, 03/13/24
Past performance is no guarantee of future results.
Economic forecasts set forth may not develop as predicted and are subject to change.
Moreover, upon exiting its negative rate policy, according to Reuters, the BOJ will also ditch its bond yield curve control and discontinue purchases of risky assets such as exchange-traded funds (ETF), putting a formal end to the most aggressive monetary accommodation of former Governor Haruhiko Kuroda, which has been in place since 2013. To borrow a phrase from Bob Dylan, the times, they are a-changin’.
 Source: LPL Research, Bloomberg, 03/13/24
All indexes are unmanaged and cannot be invested into directly. Past performance is no guarantee of future results.
Source: LPL Research, Bloomberg, 03/13/24
All indexes are unmanaged and cannot be invested into directly. Past performance is no guarantee of future results.
 Ocean City Financial Group
Mark R. Reimet CFP®
801 ASBURY AVENUE
SUITE 650
OCEAN CITY, NJ 08226
609-814-1100 Office
[email protected]
OceanCityFinancialGroup.com
Securities and advisory services offered through LPL Financial, a registered investment advisor, Member FINRA/SIPC. LPL Financial and Ocean City Financial Group are separate entities.
IMPORTANT DISCLOSURES
This material is for general information only and is not intended to provide specific advice or recommendations for any individual. There is no assurance that the views or strategies discussed are suitable for all investors or will yield positive outcomes. Investing involves risks including possible loss of principal. Any economic forecasts set forth may not develop as predicted and are subject to change.
References to markets, asset classes, and sectors are generally regarding the corresponding market index. Indexes are unmanaged statistical composites and cannot be invested into directly. Index performance is not indicative of the performance of any investment and does not reflect fees, expenses, or sales charges. All performance referenced is historical and is no guarantee of future results.
Any company names noted herein are for educational purposes only and not an indication of trading intent or a solicitation of their products or services. LPL Financial doesn’t provide research on individual equities.
All information is believed to be from reliable sources; however, LPL Financial makes no representation as to its completeness or accuracy.
U.S. Treasuries may be considered “safe haven” investments but do carry some degree of risk including interest rate, credit, and market risk. Bonds are subject to market and interest rate risk if sold prior to maturity. Bond values will decline as interest rates rise and bonds are subject to availability and change in price.
The Standard & Poor’s 500 Index (S&P500) is a capitalization-weighted index of 500 stocks designed to measure performance of the broad domestic economy through changes in the aggregate market value of 500 stocks representing all major industries.
The PE ratio (price-to-earnings ratio) is a measure of the price paid for a share relative to the annual net income or profit earned by the firm per share. It is a financial ratio used for valuation: a higher PE ratio means that investors are paying more for each unit of net income, so the stock is more expensive compared to one with lower PE ratio.
Earnings per share (EPS) is the portion of a company’s profit allocated to each outstanding share of common stock. EPS serves as an indicator of a company’s profitability.
Earnings per share is generally considered to be the single most important variable in determining a share’s price. It is also a major component used to calculate the price-to-earnings valuation ratio.
All index data from FactSet.
This research material has been prepared by LPL Financial LLC.
Securities and advisory services offered through LPL Financial (LPL), a registered investment advisor and broker-dealer (member FINRA/SIPC). Insurance products are offered through LPL or its licensed affiliates. To the extent you are receiving investment advice from a separately registered independent investment advisor that is not an LPL affiliate, please note LPL makes no representation with respect to such entity.
Not Insured by FDIC/NCUA or Any Other Government Agency
Not Bank/Credit Union Guaranteed
Not Bank/Credit Union Deposits or Obligations
May Lose Value
RES-000823-0224 | For Public Use | Tracking #553977 (Exp. 03/2025)
For a list of descriptions of the indexes referenced in this publication, please visit our website at lplresearch.com/definitions.
Ocean City Financial Group
Mark R. Reimet CFP®
801 ASBURY AVENUE
SUITE 650
OCEAN CITY, NJ 08226
609-814-1100 Office
[email protected]
OceanCityFinancialGroup.com
Securities and advisory services offered through LPL Financial, a registered investment advisor, Member FINRA/SIPC. LPL Financial and Ocean City Financial Group are separate entities.
IMPORTANT DISCLOSURES
This material is for general information only and is not intended to provide specific advice or recommendations for any individual. There is no assurance that the views or strategies discussed are suitable for all investors or will yield positive outcomes. Investing involves risks including possible loss of principal. Any economic forecasts set forth may not develop as predicted and are subject to change.
References to markets, asset classes, and sectors are generally regarding the corresponding market index. Indexes are unmanaged statistical composites and cannot be invested into directly. Index performance is not indicative of the performance of any investment and does not reflect fees, expenses, or sales charges. All performance referenced is historical and is no guarantee of future results.
Any company names noted herein are for educational purposes only and not an indication of trading intent or a solicitation of their products or services. LPL Financial doesn’t provide research on individual equities.
All information is believed to be from reliable sources; however, LPL Financial makes no representation as to its completeness or accuracy.
U.S. Treasuries may be considered “safe haven” investments but do carry some degree of risk including interest rate, credit, and market risk. Bonds are subject to market and interest rate risk if sold prior to maturity. Bond values will decline as interest rates rise and bonds are subject to availability and change in price.
The Standard & Poor’s 500 Index (S&P500) is a capitalization-weighted index of 500 stocks designed to measure performance of the broad domestic economy through changes in the aggregate market value of 500 stocks representing all major industries.
The PE ratio (price-to-earnings ratio) is a measure of the price paid for a share relative to the annual net income or profit earned by the firm per share. It is a financial ratio used for valuation: a higher PE ratio means that investors are paying more for each unit of net income, so the stock is more expensive compared to one with lower PE ratio.
Earnings per share (EPS) is the portion of a company’s profit allocated to each outstanding share of common stock. EPS serves as an indicator of a company’s profitability.
Earnings per share is generally considered to be the single most important variable in determining a share’s price. It is also a major component used to calculate the price-to-earnings valuation ratio.
All index data from FactSet.
This research material has been prepared by LPL Financial LLC.
Securities and advisory services offered through LPL Financial (LPL), a registered investment advisor and broker-dealer (member FINRA/SIPC). Insurance products are offered through LPL or its licensed affiliates. To the extent you are receiving investment advice from a separately registered independent investment advisor that is not an LPL affiliate, please note LPL makes no representation with respect to such entity.
Not Insured by FDIC/NCUA or Any Other Government Agency
Not Bank/Credit Union Guaranteed
Not Bank/Credit Union Deposits or Obligations
May Lose Value
RES-000823-0224 | For Public Use | Tracking #553977 (Exp. 03/2025)
For a list of descriptions of the indexes referenced in this publication, please visit our website at lplresearch.com/definitions.


