To Learn More, Be Sure to Visit - oceancityfinancialgroup.com
Jeffrey Buchbinder, CFA, Chief Equity Strategist


With the S&P 500 having recently ascended to a fresh record high after such a strong 2023, it’s natural for investors to worry that valuations have become over-extended. On traditional valuation measures, valuations do appear high and it does seem reasonable to expect more moderate stock market returns going forward. Here we walk through several different stock valuation approaches to get a more complete picture and even make the case that they aren’t as pricey as they look.
STOCKS ARE EXPENSIVE BY TRADITIONAL VALUATION MEASURES
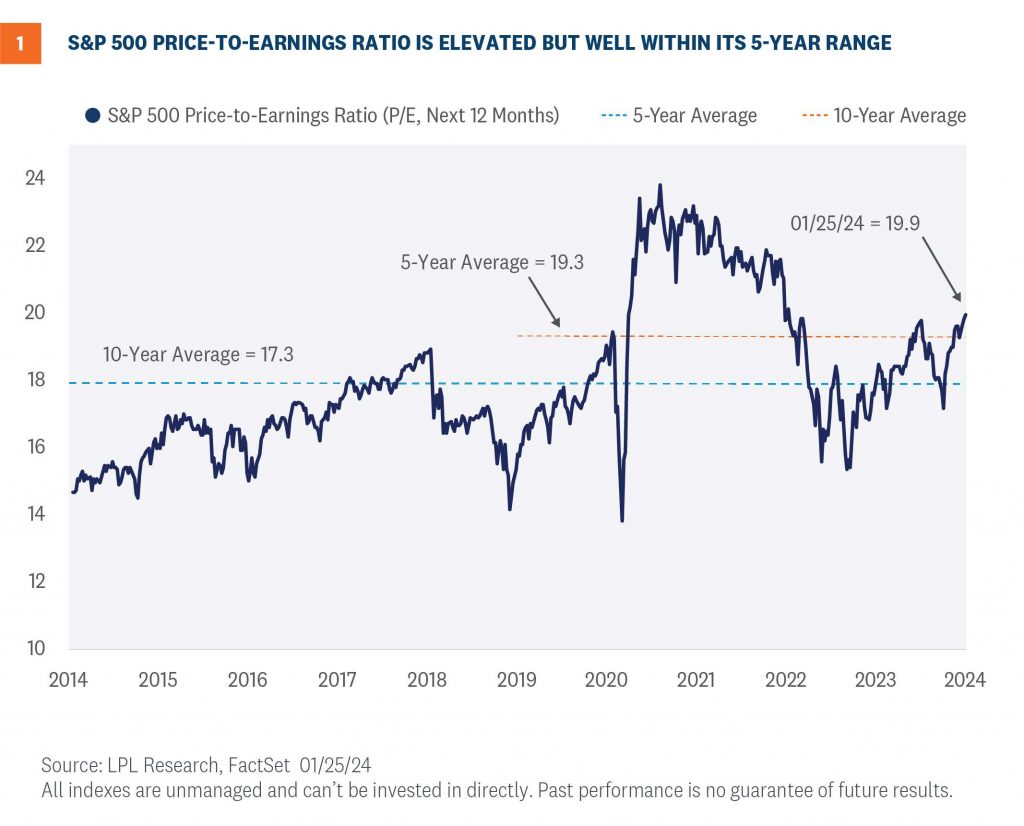
Based on the most common valuation metrics, such as the price-to-earnings ratio (P/E), stock market valuations are elevated. The S&P 500 Index is trading at a P/E near 20 times the consensus earnings estimate for the next 12 months (source: FactSet), compared to the long-term average of roughly 17 (Figure 1).
 While we acknowledge this P/E is on the high side, if there was a time to pay up for earnings it should be when growth is reaccelerating after a downturn. Recall S&P 500 earnings were in recession last year, with year-over-year earnings growth resuming in the third quarter after three straight quarters of earnings declines. While LPL Research expects 7 – 8% growth in S&P 500 earnings per share this year, a soft-landing scenario could lift earnings beyond that forecast, making stocks look a bit cheaper.
Those soft-landing prospects are brighter given it’s an election year, which could bring additional stimulus from the Biden Administration, with or without congressional approval (regulatory actions, or inactions, can also provide an economic lift). The White House is well aware that no U.S. president in modern history has been re-elected when a recession occurs during an election year.
EQUITY RISK PREMIUM OFFERS MORE COMPLETE, SLIGHTLY BETTER, PICTURE
To get a more complete picture of valuations, we factor in interest rates. History shows higher interest rates have translated into lower stock valuations and vice versa. Consider the fundamental value of a stock is the present value of the company’s future cash flows. That means when we discount future earnings, or cash flows, which is a purer measure of a company’s fundamental value—interest rates come into play. Interest rates also matter to stock valuations because bonds compete with stocks for investors’ investment dollars.
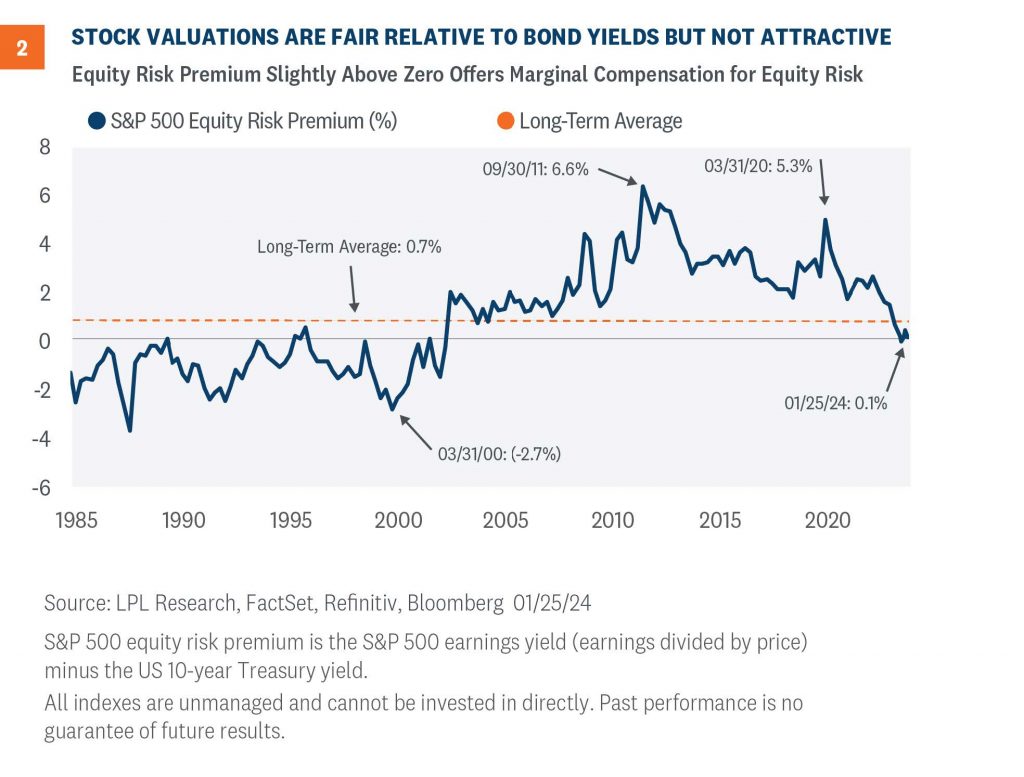
So, to incorporate interest rate levels into our evaluation of P/E ratios and get this fuller picture, we calculate an equity risk premium, or ERP. This statistic compares the earnings yield on the S&P 500 (the inverse of the P/E) to the 10-year U.S. Treasury yield. Essentially, an ERP compares the earnings generated by stocks to the income generated by bonds (in this case, the yield on the 10-year Treasury). By putting stocks and bonds in the same terms, they can be compared on an apples-to-apples basis to see if investors are getting enough earnings “compensation” for the additional risk they are taking by owning equities relative to lower-risk Treasury bonds.
As of January 25, 2024, the ERP for the S&P 500 Index was 0.1%, which is below the long-term average of 0.7% (Figure 2). (Higher values mean stocks are less expensive relative to bonds, and vice versa.) Using the consensus earnings estimate for the next 12 months rather than the last 12 months pushes the ERP up to a more attractive level near 1%, but even at that number, the case for stocks over bonds on valuations is difficult to make. In other words, even factoring in relatively low interest rates by historical standards, with the 10-year yield near 4%, at best we can argue stock valuations are fair. Strong momentum and corporate fundamentals leave us comfortable with our neutral tactical stance on equities, but there is not much room for error. And we should watch the risks closely, particularly geopolitics.
 CASH FLOW VALUATIONS TELL A SIMILAR STORY
Earnings are an accounting measure that can be distorted and shifted around, even while following generally accepted accounting practices (GAAP). For that reason, we view cash flows as potentially more important than earnings and a purer measure of the profits a business generates over time.
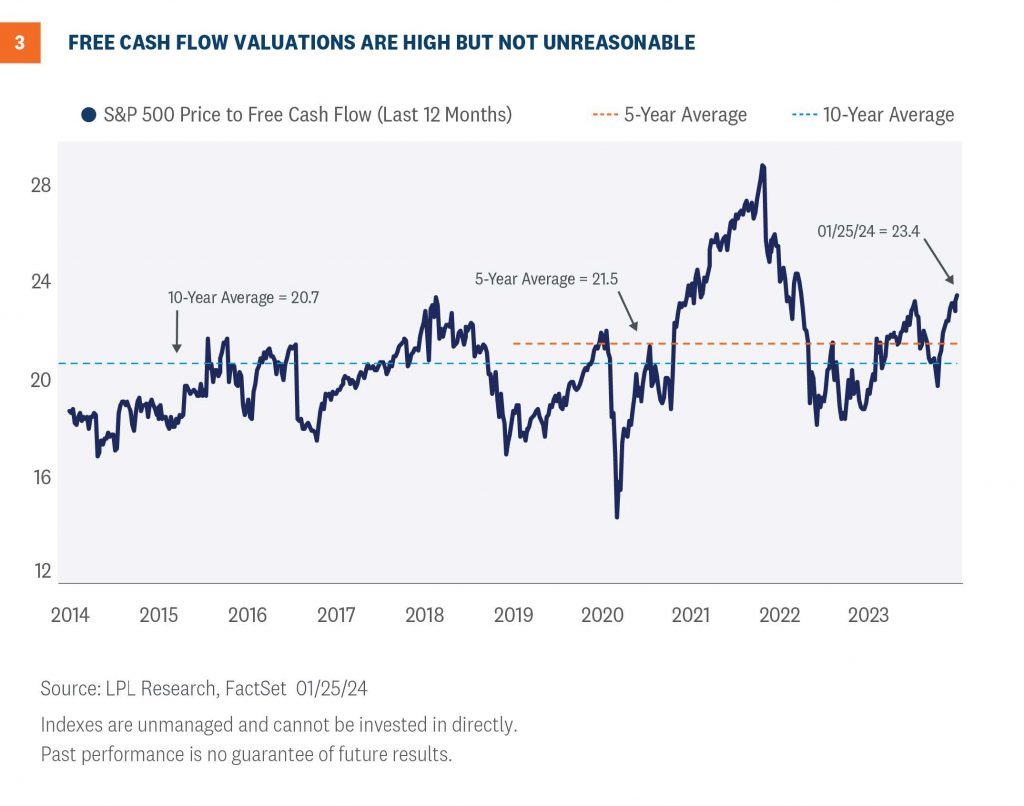
To value securities, or an index, on cash flow, we like to use free cash flow, or cash flow left after operating expenses and capital investments relative to price. By this measure, the S&P 500 is trading at a multiple of 23, about two points above the 5-year average and six points above the 10-year average (Figure 3). As a result, based on cash flows, we would suggest valuations are on the high side but not extreme.
 Similar to our assessment of P/E ratios, cash flows have been somewhat depressed during the post-pandemic inflationary period and may have more upside than they typically do. Further, the S&P 500 is less capital intensive than it used to be. In fact, one could argue that nearly half of the index reflects the digital economy — roughly 30% technology, 9% communication services, 5% internet retail, including Amazon (AMZN) and others, and even a couple points of digital payments (within financials) and digital healthcare.
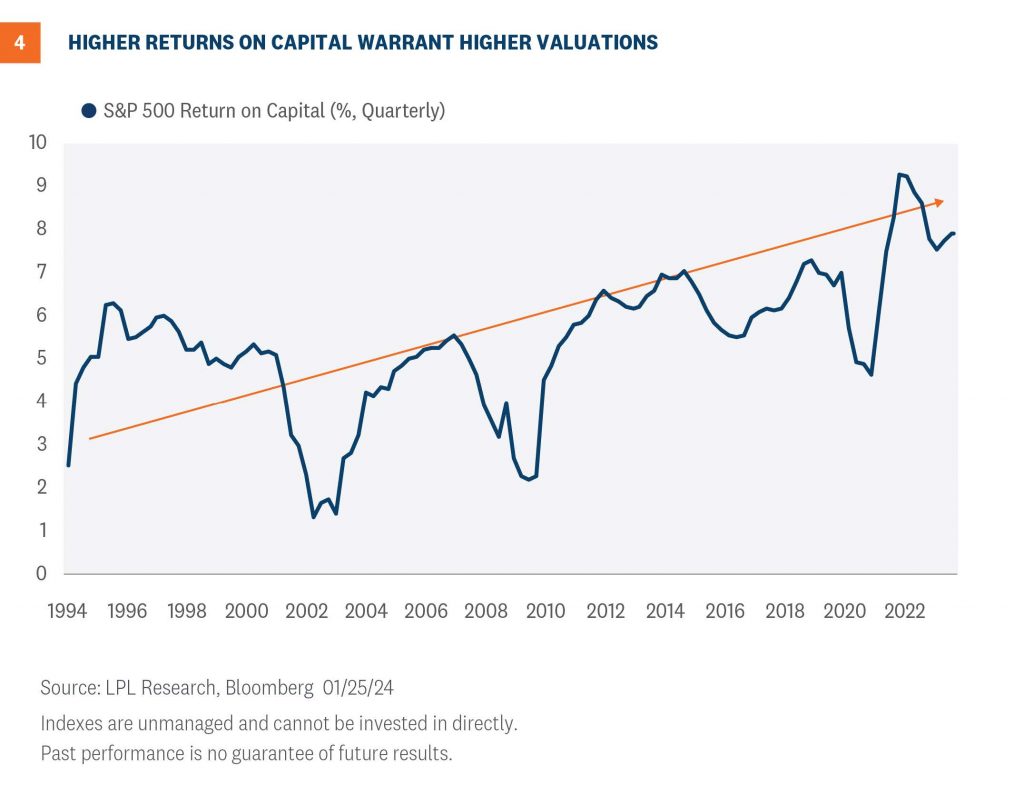
These are generally more “asset-lite” business models with higher returns on capital. In fact, returns on capital for the S&P 500 have moved significantly higher, even since the productivity boom and economic “digitization” in the late 1990s (Figure 4). This profit stream from a more profitable, less capital-intensive corporate America is worth more, which is likely a key reason why higher valuations have been sustained the past several years and may remain elevated.
 SUMMARY
Stock valuations are on the high side by most commonly used metrics, whether based on earnings or cash flows. When considering interest rates, they look more reasonable. When considering earnings have been somewhat depressed by inflation and are poised to accelerate in 2024, especially if the U.S. economy delivers that sought-after soft landing, paying higher valuations for stocks feels less uncomfortable. Add the fact that the digital economy has lifted returns on capital because of higher profit margins and less capital-intensive business models, and the argument that valuations are fair garners more support. Finally, consider valuations are not good timing tools from year to year, and the risk-reward trade-off between stocks and bonds still looks balanced to us.
So, even with the S&P 500 at record highs, 19% above the October 2023 low, and up nearly 40% since the current bull market began in October 2022, LPL’s Strategic and Tactical Asset Allocation Committee (STAAC) maintains its neutral equities stance.
The STAAC continues to favor a tilt toward domestic over international equities, with a preference for Japan among developed markets, and an underweight position in emerging markets (EM). The STAAC recommends a modest overweight to fixed income, funded from cash to enable the neutral equities position.
 Ocean City Financial Group
Mark R. Reimet CFP®
801 ASBURY AVENUE
SUITE 650
OCEAN CITY, NJ 08226
609-814-1100 Office
[email protected]
OceanCityFinancialGroup.com
Securities and advisory services offered through LPL Financial, a registered investment advisor, Member FINRA/SIPC. LPL Financial and Ocean City Financial Group are separate entities.
IMPORTANT DISCLOSURES
This material is for general information only and is not intended to provide specific advice or recommendations for any individual. There is no assurance that the views or strategies discussed are suitable for all investors or will yield positive outcomes. Investing involves risks including possible loss of principal. Any economic forecasts set forth may not develop as predicted and are subject to change.
References to markets, asset classes, and sectors are generally regarding the corresponding market index. Indexes are unmanaged statistical composites and cannot be invested into directly. Index performance is not indicative of the performance of any investment and does not reflect fees, expenses, or sales charges. All performance referenced is historical and is no guarantee of future results.
Any company names noted herein are for educational purposes only and not an indication of trading intent or a solicitation of their products or services. LPL Financial doesn’t provide research on individual equities.
All information is believed to be from reliable sources; however, LPL Financial makes no representation as to its completeness or accuracy.
U.S. Treasuries may be considered “safe haven” investments but do carry some degree of risk including interest rate, credit, and market risk. Bonds are subject to market and interest rate risk if sold prior to maturity. Bond values will decline as interest rates rise and bonds are subject to availability and change in price.
The Standard & Poor’s 500 Index (S&P500) is a capitalization-weighted index of 500 stocks designed to measure performance of the broad domestic economy through changes in the aggregate market value of 500 stocks representing all major industries.
The PE ratio (price-to-earnings ratio) is a measure of the price paid for a share relative to the annual net income or profit earned by the firm per share. It is a financial ratio used for valuation: a higher PE ratio means that investors are paying more for each unit of net income, so the stock is more expensive compared to one with lower PE ratio.
Earnings per share (EPS) is the portion of a company’s profit allocated to each outstanding share of common stock. EPS serves as an indicator of a company’s profitability.
Earnings per share is generally considered to be the single most important variable in determining a share’s price. It is also a major component used to calculate the price-to-earnings valuation ratio.
All index data from FactSet.
This research material has been prepared by LPL Financial LLC.
Securities and advisory services offered through LPL Financial (LPL), a registered investment advisor and broker-dealer (member FINRA/SIPC). Insurance products are offered through LPL or its licensed affiliates. To the extent you are receiving investment advice from a separately registered independent investment advisor that is not an LPL affiliate, please note LPL makes no representation with respect to such entity.
Not Insured by FDIC/NCUA or Any Other Government Agency
Not Bank/Credit Union Guaranteed
Not Bank/Credit Union Deposits or Obligations
May Lose Value
RES-000524-1223 | For Public Use | Tracking # 533432 (Exp. 01/2026)