
To Learn More, Be Sure to Visit - oceancityfinancialgroup.com
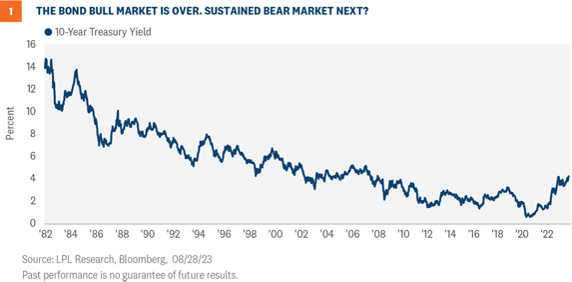
Lawrence Gillum, CFA, Chief Fixed Income Strategist Fixed income investors have had a rough time over the last few years. Normally a staid asset class, core bonds (as proxied by the Bloomberg Aggregate Bond Index) have seen negative returns over the last two calendar years and could potentially see negative returns for a third straight year— something that has never happened in the history of the core bond index (since 1975). But, despite the rapid rise in interest rates (fall in bond prices), there’s no reason to believe that we are in the beginning of a sustained bear market. Just because yields fell for many years doesn’t mean that they have to keep rising. In fact, at current levels, after years of artificially suppressed levels, long-term yields are back within longer-term ranges. And with inflation trending in the right direction and the Federal Reserve (Fed) near (at?) the end of its rate hiking campaign, we think the big move in long- term rates has already happened and interest rates are finally back to normal.
 BACK TO NORMAL
 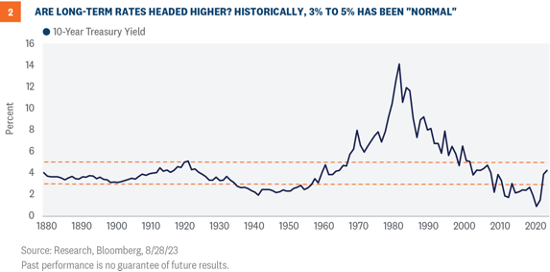 As for the recent deviation from normal, in the aftermath of the Global Financial Crisis, the U.S. experienced a decade of sluggish growth and subdued inflation. Moreover, central banks, globally, engaged in aggressive bond buying schemes to provide liquidity and stability to markets. Throw in a once in a century global pandemic, and interest rates have been kept at very low levels—one could argue artificially suppressed levels. The Fed and other central banks ripped the proverbial Band-Aid off over the last few years, and interest rates are now back into more normal levels.
Could interest rates go higher? It’s possible. With the Treasury Department expected to issue a lot of Treasury securities to fund budget deficits and with the potential for the Bank of Japan (BOJ) to finally end its aggressively loose monetary policies, we could continue to see upward pressure on yields. However, while supply/demand dynamics can influence prices in the near term, the long-term direction of yields is based on expected Fed policy. So unless the Fed isn’t done raising rates due to a resurgence of inflationary pressures (we don’t think that is likely), the big move in yields has likely already taken place. Inflation is trending in the right direction and the Fed could be near (at?) the end of its rate hiking campaign. That doesn’t mean rates are going to fall dramatically from current levels though, and that is fine for the longer-term prospects for fixed income investors.
As for the recent deviation from normal, in the aftermath of the Global Financial Crisis, the U.S. experienced a decade of sluggish growth and subdued inflation. Moreover, central banks, globally, engaged in aggressive bond buying schemes to provide liquidity and stability to markets. Throw in a once in a century global pandemic, and interest rates have been kept at very low levels—one could argue artificially suppressed levels. The Fed and other central banks ripped the proverbial Band-Aid off over the last few years, and interest rates are now back into more normal levels.
Could interest rates go higher? It’s possible. With the Treasury Department expected to issue a lot of Treasury securities to fund budget deficits and with the potential for the Bank of Japan (BOJ) to finally end its aggressively loose monetary policies, we could continue to see upward pressure on yields. However, while supply/demand dynamics can influence prices in the near term, the long-term direction of yields is based on expected Fed policy. So unless the Fed isn’t done raising rates due to a resurgence of inflationary pressures (we don’t think that is likely), the big move in yields has likely already taken place. Inflation is trending in the right direction and the Fed could be near (at?) the end of its rate hiking campaign. That doesn’t mean rates are going to fall dramatically from current levels though, and that is fine for the longer-term prospects for fixed income investors.
 As we mentioned in last week’s Weekly Market Commentary, the fed funds rate is likely going to stay higher than it has over the past decade, which means the 10-year Treasury yield is likely going to stay higher than it has over the last decade. If the new neutral fed funds rate is around 3.5%, then that means the 10-year Treasury is likely going to be around 4.0%, plus or minus. Now of course, that rate will fluctuate on a daily basis but the 10-year yield could average around 4% over the next decade, which is what it generally averaged in the decade before the Global Financial Crisis (GFC).
The good news for bond investors: from the start of 2000 until the GFC, the Bloomberg Aggregate Bond Index generated around 6% average annual returns. Paradoxically perhaps, the longer Treasury yields stay higher, the more enduring fixed income is as an asset class. Starting yields are the best predictor of future returns (over longer time horizons), so if Treasury yields remain elevated, that means yields for other bond asset classes will be higher as well, which means fixed income returns could likely be higher too.
As we mentioned in last week’s Weekly Market Commentary, the fed funds rate is likely going to stay higher than it has over the past decade, which means the 10-year Treasury yield is likely going to stay higher than it has over the last decade. If the new neutral fed funds rate is around 3.5%, then that means the 10-year Treasury is likely going to be around 4.0%, plus or minus. Now of course, that rate will fluctuate on a daily basis but the 10-year yield could average around 4% over the next decade, which is what it generally averaged in the decade before the Global Financial Crisis (GFC).
The good news for bond investors: from the start of 2000 until the GFC, the Bloomberg Aggregate Bond Index generated around 6% average annual returns. Paradoxically perhaps, the longer Treasury yields stay higher, the more enduring fixed income is as an asset class. Starting yields are the best predictor of future returns (over longer time horizons), so if Treasury yields remain elevated, that means yields for other bond asset classes will be higher as well, which means fixed income returns could likely be higher too.
 Ocean City Financial Group
Mark R. Reimet CFP®
801 ASBURY AVENUE
SUITE 650
OCEAN CITY, NJ 08226
609-814-1100 Office
[email protected]
OceanCityFinancialGroup.com
Securities and advisory services offered through LPL Financial, a registered investment advisor, Member FINRA/SIPC. LPL Financial and Ocean City Financial Group are separate entities.
IMPORTANT DISCLOSURES
This material is for general information only and is not intended to provide specific advice or recommendations for any individual. There is no assurance that the views or strategies discussed are suitable for all investors or will yield positive outcomes. Investing involves risks including possible loss of principal. Any economic forecasts set forth may not develop as predicted and are subject to change.
References to markets, asset classes, and sectors are generally regarding the corresponding market index. Indexes are unmanaged statistical composites and cannot be invested into directly. Index performance is not indicative of the performance of any investment and does not reflect fees, expenses, or sales charges. All performance referenced is historical and is no guarantee of future results.
Any company names noted herein are for educational purposes only and not an indication of trading intent or a solicitation of their products or services. LPL Financial doesn’t provide research on individual equities.
All information is believed to be from reliable sources; however, LPL Financial makes no representation as to its completeness or accuracy.
U.S. Treasuries may be considered “safe haven” investments but do carry some degree of risk including interest rate, credit, and market risk. Bonds are subject to market and interest rate risk if sold prior to maturity. Bond values will decline as interest rates rise and bonds are subject to availability and change in price.
The Standard & Poor’s 500 Index (S&P500) is a capitalization-weighted index of 500 stocks designed to measure performance of the broad domestic economy through changes in the aggregate market value of 500 stocks representing all major industries.
The PE ratio (price-to-earnings ratio) is a measure of the price paid for a share relative to the annual net income or profit earned by the firm per share. It is a financial ratio used for valuation: a higher PE ratio means that investors are paying more for each unit of net income, so the stock is more expensive compared to one with lower PE ratio.
Earnings per share (EPS) is the portion of a company’s profit allocated to each outstanding share of common stock. EPS serves as an indicator of a company’s profitability.
Earnings per share is generally considered to be the single most important variable in determining a share’s price. It is also a major component used to calculate the price-to-earnings valuation ratio.
All index data from FactSet.
This research material has been prepared by LPL Financial LLC.
Securities and advisory services offered through LPL Financial (LPL), a registered investment advisor and broker-dealer (member FINRA/SIPC). Insurance products are offered through LPL or its licensed affiliates. To the extent you are receiving investment advice from a separately registered independent investment advisor that is not an LPL affiliate, please note LPL makes no representation with respect to such entity.
Not Insured by FDIC/NCUA or Any Other Government Agency
Not Bank/Credit Union Guaranteed
Not Bank/Credit Union Deposits or Obligations
May Lose Value
RES-1627733-0823 | For Public Use | Tracking # 474205 (Exp. 09/24)
For a list of descriptions of the indexes referenced in this publication, please visit our website at lplresearch.com/definitions.
Ocean City Financial Group
Mark R. Reimet CFP®
801 ASBURY AVENUE
SUITE 650
OCEAN CITY, NJ 08226
609-814-1100 Office
[email protected]
OceanCityFinancialGroup.com
Securities and advisory services offered through LPL Financial, a registered investment advisor, Member FINRA/SIPC. LPL Financial and Ocean City Financial Group are separate entities.
IMPORTANT DISCLOSURES
This material is for general information only and is not intended to provide specific advice or recommendations for any individual. There is no assurance that the views or strategies discussed are suitable for all investors or will yield positive outcomes. Investing involves risks including possible loss of principal. Any economic forecasts set forth may not develop as predicted and are subject to change.
References to markets, asset classes, and sectors are generally regarding the corresponding market index. Indexes are unmanaged statistical composites and cannot be invested into directly. Index performance is not indicative of the performance of any investment and does not reflect fees, expenses, or sales charges. All performance referenced is historical and is no guarantee of future results.
Any company names noted herein are for educational purposes only and not an indication of trading intent or a solicitation of their products or services. LPL Financial doesn’t provide research on individual equities.
All information is believed to be from reliable sources; however, LPL Financial makes no representation as to its completeness or accuracy.
U.S. Treasuries may be considered “safe haven” investments but do carry some degree of risk including interest rate, credit, and market risk. Bonds are subject to market and interest rate risk if sold prior to maturity. Bond values will decline as interest rates rise and bonds are subject to availability and change in price.
The Standard & Poor’s 500 Index (S&P500) is a capitalization-weighted index of 500 stocks designed to measure performance of the broad domestic economy through changes in the aggregate market value of 500 stocks representing all major industries.
The PE ratio (price-to-earnings ratio) is a measure of the price paid for a share relative to the annual net income or profit earned by the firm per share. It is a financial ratio used for valuation: a higher PE ratio means that investors are paying more for each unit of net income, so the stock is more expensive compared to one with lower PE ratio.
Earnings per share (EPS) is the portion of a company’s profit allocated to each outstanding share of common stock. EPS serves as an indicator of a company’s profitability.
Earnings per share is generally considered to be the single most important variable in determining a share’s price. It is also a major component used to calculate the price-to-earnings valuation ratio.
All index data from FactSet.
This research material has been prepared by LPL Financial LLC.
Securities and advisory services offered through LPL Financial (LPL), a registered investment advisor and broker-dealer (member FINRA/SIPC). Insurance products are offered through LPL or its licensed affiliates. To the extent you are receiving investment advice from a separately registered independent investment advisor that is not an LPL affiliate, please note LPL makes no representation with respect to such entity.
Not Insured by FDIC/NCUA or Any Other Government Agency
Not Bank/Credit Union Guaranteed
Not Bank/Credit Union Deposits or Obligations
May Lose Value
RES-1627733-0823 | For Public Use | Tracking # 474205 (Exp. 09/24)
For a list of descriptions of the indexes referenced in this publication, please visit our website at lplresearch.com/definitions.


