
To Learn More, Be Sure to Visit - oceancityfinancialgroup.com
Lawrence Gillum, CFA, Chief Fixed Income Strategist It’s been another volatile year for municipal (muni) investors this year. While generally outperforming U.S. Treasuries, the Bloomberg Muni Index is on track for its second calendar year of negative returns—something that has never happened before. But, while volatility will likely persist over the coming months, we think muni investors may be able to catch a break, especially if the Federal Reserve (Fed) is done with its aggressive rate hiking campaign. Moreover, the next few months have historically been favorable for muni investors. So, with still solid fundamentals, the broader muni market may be in for a year-end rally, which would certainly be a nice reprieve for investors suffering from one of the worst muni drawdowns on record.
The broader fixed income market finally caught a break last week after the Fed and Treasury Department both provided positive catalysts to Treasury markets. Regarding the former, as expected the Fed kept its policy rate unchanged but seemingly acknowledged the risks were balanced between doing too much versus doing too little. As such, markets took that acknowledgement as the Fed was done raising rates, which has historically been a good thing for bond markets (more on this later).
As for the latter, after much anticipation, in its quarterly refunding announcement the Treasury Department, perhaps due to concerns around Treasury market volatility, announced plans to increase the amount of Treasury coupon securities by less than what markets were expecting. Treasury supply concerns have pushed yields higher recently, so this decision took some pressure off longer maturity Treasury yields. Throw in economic data that came in weaker than expected, and Treasury yields were lower across the curve last week.
So, what does this have to do with munis? The volatility in the muni market has largely been the result of what has happened outside of the muni market. The muni market has had to deal with numerous external factors— aftershocks of the regional banking crisis, tax season, elevated levels of selling by banks, unexpectedly large federal budget deficits, and a hawkish Fed. So, with the last two potentially out of the picture, we think the set-up for muni investors could be a positive one.
It’s been another volatile year for municipal (muni) investors this year. While generally outperforming U.S. Treasuries, the Bloomberg Muni Index is on track for its second calendar year of negative returns—something that has never happened before. But, while volatility will likely persist over the coming months, we think muni investors may be able to catch a break, especially if the Federal Reserve (Fed) is done with its aggressive rate hiking campaign. Moreover, the next few months have historically been favorable for muni investors. So, with still solid fundamentals, the broader muni market may be in for a year-end rally, which would certainly be a nice reprieve for investors suffering from one of the worst muni drawdowns on record.
The broader fixed income market finally caught a break last week after the Fed and Treasury Department both provided positive catalysts to Treasury markets. Regarding the former, as expected the Fed kept its policy rate unchanged but seemingly acknowledged the risks were balanced between doing too much versus doing too little. As such, markets took that acknowledgement as the Fed was done raising rates, which has historically been a good thing for bond markets (more on this later).
As for the latter, after much anticipation, in its quarterly refunding announcement the Treasury Department, perhaps due to concerns around Treasury market volatility, announced plans to increase the amount of Treasury coupon securities by less than what markets were expecting. Treasury supply concerns have pushed yields higher recently, so this decision took some pressure off longer maturity Treasury yields. Throw in economic data that came in weaker than expected, and Treasury yields were lower across the curve last week.
So, what does this have to do with munis? The volatility in the muni market has largely been the result of what has happened outside of the muni market. The muni market has had to deal with numerous external factors— aftershocks of the regional banking crisis, tax season, elevated levels of selling by banks, unexpectedly large federal budget deficits, and a hawkish Fed. So, with the last two potentially out of the picture, we think the set-up for muni investors could be a positive one.
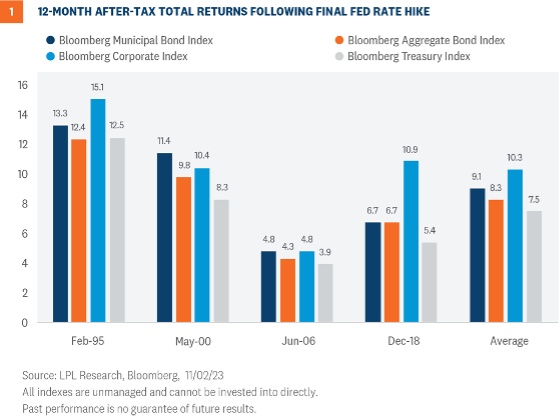 Our base case is the Fed may raise rates one more time but that would be the end of this rate hiking cycle, which has been the major headwind for markets. So, with the Fed out of the way, the muni market will likely go back to trading largely on internal dynamics which remain largely positive.
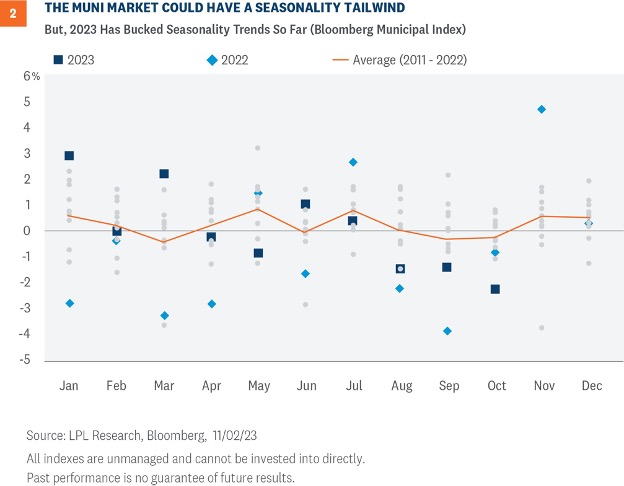 So far, 2023 has bucked the trend so the typical seasonal patterns may not hold throughout the rest of the year. According to recent Fed data, retail investors (66%) remain the largest ownership block of holders, with banks (15%) and insurance companies (11%) also large holders. So, despite higher yields, record outflows from retail investors in 2022 have been followed by further outflows this year. Despite still strong fundamentals and improved valuations, retail investors have, so far, been unwilling to stay the course, which has offset most of the favorable supply dynamics. Until retail investor outflows slow or reverse, the typical seasonal patterns may not hold. But if the seasonal patterns do hold, muni investors could end the year with a positive tailwind to returns.
 And while there is still a lot of uncertainty surrounding the impact on commercial real estate (CRE) in general, the New York City comptroller recently provided some scenario analysis on that subject. According to their work, even in a doomsday scenario, where property values decline by 40% over the next few years, there would be a revenue shortfall of only about 1.4% of city tax revenues. Obviously, this is just a scenario for New York City but given the importance of real estate taxes to its operating budgets, it does provide some relief that muni budgets broadly won’t be severely impacted. And residential valuations are holding up, which helps offset some of the CRE issues. Nonetheless, it is an area we’re watching.
 Ocean City Financial Group
Mark R. Reimet CFP®
801 ASBURY AVENUE
SUITE 650
OCEAN CITY, NJ 08226
609-814-1100 Office
[email protected]
OceanCityFinancialGroup.com
Securities and advisory services offered through LPL Financial, a registered investment advisor, Member FINRA/SIPC. LPL Financial and Ocean City Financial Group are separate entities.
IMPORTANT DISCLOSURES
This material is for general information only and is not intended to provide specific advice or recommendations for any individual. There is no assurance that the views or strategies discussed are suitable for all investors or will yield positive outcomes. Investing involves risks including possible loss of principal. Any economic forecasts set forth may not develop as predicted and are subject to change.
References to markets, asset classes, and sectors are generally regarding the corresponding market index. Indexes are unmanaged statistical composites and cannot be invested into directly. Index performance is not indicative of the performance of any investment and does not reflect fees, expenses, or sales charges. All performance referenced is historical and is no guarantee of future results.
Any company names noted herein are for educational purposes only and not an indication of trading intent or a solicitation of their products or services. LPL Financial doesn’t provide research on individual equities.
All information is believed to be from reliable sources; however, LPL Financial makes no representation as to its completeness or accuracy.
U.S. Treasuries may be considered “safe haven” investments but do carry some degree of risk including interest rate, credit, and market risk. Bonds are subject to market and interest rate risk if sold prior to maturity. Bond values will decline as interest rates rise and bonds are subject to availability and change in price.
The Standard & Poor’s 500 Index (S&P500) is a capitalization-weighted index of 500 stocks designed to measure performance of the broad domestic economy through changes in the aggregate market value of 500 stocks representing all major industries.
The PE ratio (price-to-earnings ratio) is a measure of the price paid for a share relative to the annual net income or profit earned by the firm per share. It is a financial ratio used for valuation: a higher PE ratio means that investors are paying more for each unit of net income, so the stock is more expensive compared to one with lower PE ratio.
Earnings per share (EPS) is the portion of a company’s profit allocated to each outstanding share of common stock. EPS serves as an indicator of a company’s profitability.
Earnings per share is generally considered to be the single most important variable in determining a share’s price. It is also a major component used to calculate the price-to-earnings valuation ratio.
All index data from FactSet.
This research material has been prepared by LPL Financial LLC.
Securities and advisory services offered through LPL Financial (LPL), a registered investment advisor and broker-dealer (member FINRA/SIPC). Insurance products are offered through LPL or its licensed affiliates. To the extent you are receiving investment advice from a separately registered independent investment advisor that is not an LPL affiliate, please note LPL makes no representation with respect to such entity.
Not Insured by FDIC/NCUA or Any Other Government Agency
Not Bank/Credit Union Guaranteed
Not Bank/Credit Union Deposits or Obligations
May Lose Value
RES-000316-1023W | For Public Use | Tracking # 500766 (Exp. 11/24)
For a list of descriptions of the indexes referenced in this publication, please visit our website at lplresearch.com/definitions.
Ocean City Financial Group
Mark R. Reimet CFP®
801 ASBURY AVENUE
SUITE 650
OCEAN CITY, NJ 08226
609-814-1100 Office
[email protected]
OceanCityFinancialGroup.com
Securities and advisory services offered through LPL Financial, a registered investment advisor, Member FINRA/SIPC. LPL Financial and Ocean City Financial Group are separate entities.
IMPORTANT DISCLOSURES
This material is for general information only and is not intended to provide specific advice or recommendations for any individual. There is no assurance that the views or strategies discussed are suitable for all investors or will yield positive outcomes. Investing involves risks including possible loss of principal. Any economic forecasts set forth may not develop as predicted and are subject to change.
References to markets, asset classes, and sectors are generally regarding the corresponding market index. Indexes are unmanaged statistical composites and cannot be invested into directly. Index performance is not indicative of the performance of any investment and does not reflect fees, expenses, or sales charges. All performance referenced is historical and is no guarantee of future results.
Any company names noted herein are for educational purposes only and not an indication of trading intent or a solicitation of their products or services. LPL Financial doesn’t provide research on individual equities.
All information is believed to be from reliable sources; however, LPL Financial makes no representation as to its completeness or accuracy.
U.S. Treasuries may be considered “safe haven” investments but do carry some degree of risk including interest rate, credit, and market risk. Bonds are subject to market and interest rate risk if sold prior to maturity. Bond values will decline as interest rates rise and bonds are subject to availability and change in price.
The Standard & Poor’s 500 Index (S&P500) is a capitalization-weighted index of 500 stocks designed to measure performance of the broad domestic economy through changes in the aggregate market value of 500 stocks representing all major industries.
The PE ratio (price-to-earnings ratio) is a measure of the price paid for a share relative to the annual net income or profit earned by the firm per share. It is a financial ratio used for valuation: a higher PE ratio means that investors are paying more for each unit of net income, so the stock is more expensive compared to one with lower PE ratio.
Earnings per share (EPS) is the portion of a company’s profit allocated to each outstanding share of common stock. EPS serves as an indicator of a company’s profitability.
Earnings per share is generally considered to be the single most important variable in determining a share’s price. It is also a major component used to calculate the price-to-earnings valuation ratio.
All index data from FactSet.
This research material has been prepared by LPL Financial LLC.
Securities and advisory services offered through LPL Financial (LPL), a registered investment advisor and broker-dealer (member FINRA/SIPC). Insurance products are offered through LPL or its licensed affiliates. To the extent you are receiving investment advice from a separately registered independent investment advisor that is not an LPL affiliate, please note LPL makes no representation with respect to such entity.
Not Insured by FDIC/NCUA or Any Other Government Agency
Not Bank/Credit Union Guaranteed
Not Bank/Credit Union Deposits or Obligations
May Lose Value
RES-000316-1023W | For Public Use | Tracking # 500766 (Exp. 11/24)
For a list of descriptions of the indexes referenced in this publication, please visit our website at lplresearch.com/definitions.


