
To Learn More, Be Sure to Visit - oceancityfinancialgroup.com
Jeffrey Buchbinder, CFA, Chief Equity Strategist First quarter earnings season is nearly complete, and it has caused us to regret titling our earnings preview commentary on April 10, “Malaise Continues.” While the “better than feared” label fit the past couple of earnings seasons quite well, based on the magnitude of upside surprises in the first quarter, and encouraging guidance from corporate America, that’s probably underselling it. There’s plenty to worry about the rest of the year (debt limit, recession, tightening financial conditions, a Federal Reserve (Fed) policy mistake, among them), but the risk of an additional sharp contraction in profit margins has come way down.
BIG UPSIDE SURPRISE
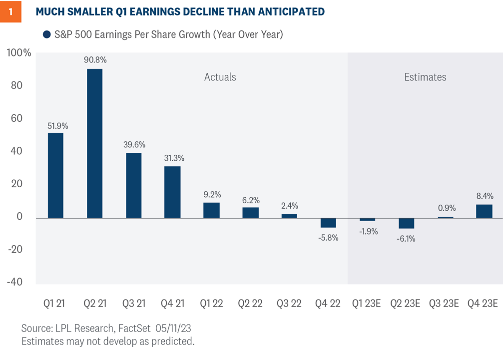
Corporate America faced several headwinds during the first quarter, including, most notably, lackluster economic growth, still-high inflation and related cost pressures, and stress in the banking system that caused financial conditions to tighten after the bank failures in March.
Plus, S&P 500 companies were coming off a difficult fourth quarter in which earnings fell short of estimates. These factors led analysts to forecast a 6-7% year-over-year earnings decline in the first quarter, slightly worse than the roughly 5% decline in the fourth quarter of 2022. What we’ve gotten has been much better than that (Figure 1).
First quarter earnings season is nearly complete, and it has caused us to regret titling our earnings preview commentary on April 10, “Malaise Continues.” While the “better than feared” label fit the past couple of earnings seasons quite well, based on the magnitude of upside surprises in the first quarter, and encouraging guidance from corporate America, that’s probably underselling it. There’s plenty to worry about the rest of the year (debt limit, recession, tightening financial conditions, a Federal Reserve (Fed) policy mistake, among them), but the risk of an additional sharp contraction in profit margins has come way down.
BIG UPSIDE SURPRISE
Corporate America faced several headwinds during the first quarter, including, most notably, lackluster economic growth, still-high inflation and related cost pressures, and stress in the banking system that caused financial conditions to tighten after the bank failures in March.
Plus, S&P 500 companies were coming off a difficult fourth quarter in which earnings fell short of estimates. These factors led analysts to forecast a 6-7% year-over-year earnings decline in the first quarter, slightly worse than the roughly 5% decline in the fourth quarter of 2022. What we’ve gotten has been much better than that (Figure 1).
 So what helped drive such a big upside surprise? We would point to these five factors:
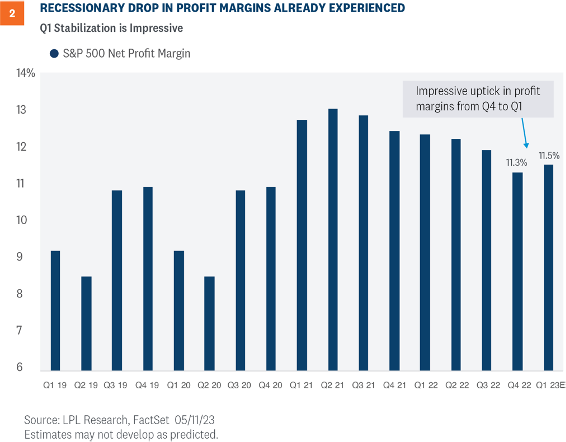 Big revenue surprise. Analysts and strategists seem to have forgotten that inflation boosts revenue. Revenue rose 4% in the first quarter of 2023 compared with forecasts below 2% prior to reporting season. Higher prices mean more revenue for someone. Given consumers came into this weak earnings period flush with cash, those prices are being absorbed better than many had anticipated. Nominal GDP, or GDP including inflation, rather than inflation adjusted, or real GDP, rose 7% year over year and tends to correlate well with revenue over time.
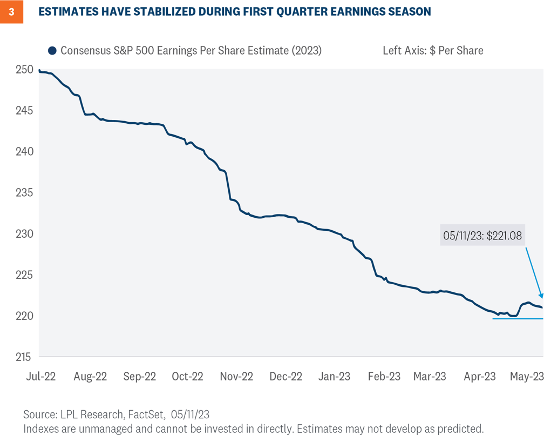 TRIMMING 2023 EARNINGS ESTIMATES ON INCREASED RECESSION RISK
In a typical year, a solid earnings season relative to expectations would not trigger a reduction in earnings estimates. But this year is anything but typical. As the odds of recession have increased, the chances of a late-year earnings rebound have diminished. In other words, as we’ve signaled in recent commentaries, our estimate of flat earnings per share (EPS) for the S&P 500 in 2023 at around $220 looks a bit high.
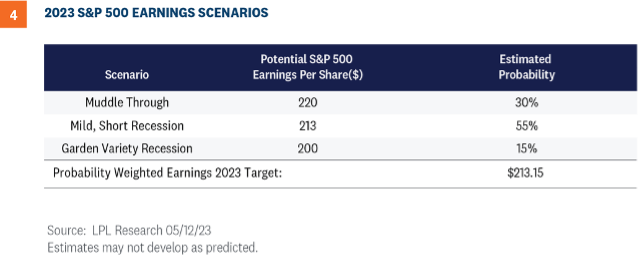
We use the following scenarios to come up with an updated, probability weighted earnings forecast for 2023:
TRIMMING 2023 EARNINGS ESTIMATES ON INCREASED RECESSION RISK
In a typical year, a solid earnings season relative to expectations would not trigger a reduction in earnings estimates. But this year is anything but typical. As the odds of recession have increased, the chances of a late-year earnings rebound have diminished. In other words, as we’ve signaled in recent commentaries, our estimate of flat earnings per share (EPS) for the S&P 500 in 2023 at around $220 looks a bit high.
We use the following scenarios to come up with an updated, probability weighted earnings forecast for 2023:
 AN EARLY LOOK AT 2024
For 2024, given the likelihood that a late-2023 recession spills over into early next year, we’re taking our forecast for S&P 500 EPS down from $240 to $230, still an 8% increase from our downwardly revised 2023 estimate and consistent with the long-term average earnings growth rate for the index.
We make no change to our year-end S&P 500 fair value target range of 4,300–4,400, with the index currently just 4% below the low end of the range. Lower interest rates support higher stock valuations, so a price-to-earnings ratio (P/E) near 19 on $230 in S&P 500 EPS in 2024 looks reasonable. Recall the 10-year Treasury yield, near 3.40%, was about 0.6% higher in early March before Silicon Valley Bank failed.
At year end, we expect the inflation outlook to look much better, enabling market participants to look through the economic malaise and toward recovery in 2024—hopefully with the debt ceiling and regional bank issues fully put to rest.
INVESTMENT OUTLOOK
Solid earnings results compared with expectations have helped keep stocks afloat in recent weeks amid debt ceiling jitters, regional bank concerns, and louder calls for recession. But we’re still in an earnings lull and a weak seasonal period for stocks. While a Fed pause is likely to arrive in June, gains may depend on the continued resilience of the U.S. economy. And the S&P 500 has had a very tough time breaking through the 4,200 chart resistance level, so we may be in for more choppiness from a technical perspective. Bottom line, while stocks may beat bonds over the rest of the year, we do not see a lot of upside.
The LPL Research Strategic and Tactical Asset Allocation Committee (STAAC) recommends a slight overweight allocation to equities, with a move back down to neutral in the near term currently under discussion. The STAAC has squared up its views on growth and value, favors large caps over small, and maintains the industrials sector as the top overall sector pick. From a pure technical analysis perspective, communication services and technology look increasingly constructive with building relative strength.
Within fixed income, the STAAC recommends an up-in-quality approach with a benchmark weight to duration. We think core bond sectors (U.S. Treasuries, Agency mortgage-backed securities (MBS), and short-maturity investment grade corporates) are currently more attractive than plus sectors (high-yield bonds and non-U.S. sectors) with the exception of preferred securities, which look attractive after having recently sold off due to the banking stresses.
AN EARLY LOOK AT 2024
For 2024, given the likelihood that a late-2023 recession spills over into early next year, we’re taking our forecast for S&P 500 EPS down from $240 to $230, still an 8% increase from our downwardly revised 2023 estimate and consistent with the long-term average earnings growth rate for the index.
We make no change to our year-end S&P 500 fair value target range of 4,300–4,400, with the index currently just 4% below the low end of the range. Lower interest rates support higher stock valuations, so a price-to-earnings ratio (P/E) near 19 on $230 in S&P 500 EPS in 2024 looks reasonable. Recall the 10-year Treasury yield, near 3.40%, was about 0.6% higher in early March before Silicon Valley Bank failed.
At year end, we expect the inflation outlook to look much better, enabling market participants to look through the economic malaise and toward recovery in 2024—hopefully with the debt ceiling and regional bank issues fully put to rest.
INVESTMENT OUTLOOK
Solid earnings results compared with expectations have helped keep stocks afloat in recent weeks amid debt ceiling jitters, regional bank concerns, and louder calls for recession. But we’re still in an earnings lull and a weak seasonal period for stocks. While a Fed pause is likely to arrive in June, gains may depend on the continued resilience of the U.S. economy. And the S&P 500 has had a very tough time breaking through the 4,200 chart resistance level, so we may be in for more choppiness from a technical perspective. Bottom line, while stocks may beat bonds over the rest of the year, we do not see a lot of upside.
The LPL Research Strategic and Tactical Asset Allocation Committee (STAAC) recommends a slight overweight allocation to equities, with a move back down to neutral in the near term currently under discussion. The STAAC has squared up its views on growth and value, favors large caps over small, and maintains the industrials sector as the top overall sector pick. From a pure technical analysis perspective, communication services and technology look increasingly constructive with building relative strength.
Within fixed income, the STAAC recommends an up-in-quality approach with a benchmark weight to duration. We think core bond sectors (U.S. Treasuries, Agency mortgage-backed securities (MBS), and short-maturity investment grade corporates) are currently more attractive than plus sectors (high-yield bonds and non-U.S. sectors) with the exception of preferred securities, which look attractive after having recently sold off due to the banking stresses.
 Ocean City Financial Group
Mark R. Reimet CFP®
801 ASBURY AVENUE
SUITE 650
OCEAN CITY, NJ 08226
609-814-1100 Office
[email protected]
OceanCityFinancialGroup.com
Securities and advisory services offered through LPL Financial, a registered investment advisor, Member FINRA/SIPC. LPL Financial and Ocean City Financial Group are separate entities.
IMPORTANT DISCLOSURES
This material is for general information only and is not intended to provide specific advice or recommendations for any individual. There is no assurance that the views or strategies discussed are suitable for all investors or will yield positive outcomes. Investing involves risks including possible loss of principal. Any economic forecasts set forth may not develop as predicted and are subject to change.
References to markets, asset classes, and sectors are generally regarding the corresponding market index. Indexes are unmanaged statistical composites and cannot be invested into directly. Index performance is not indicative of the performance of any investment and does not reflect fees, expenses, or sales charges. All performance referenced is historical and is no guarantee of future results.
Any company names noted herein are for educational purposes only and not an indication of trading intent or a solicitation of their products or services. LPL Financial doesn’t provide research on individual equities.
All information is believed to be from reliable sources; however, LPL Financial makes no representation as to its completeness or accuracy.
U.S. Treasuries may be considered “safe haven” investments but do carry some degree of risk including interest rate, credit, and market risk. Bonds are subject to market and interest rate risk if sold prior to maturity. Bond values will decline as interest rates rise and bonds are subject to availability and change in price.
The Standard & Poor’s 500 Index (S&P500) is a capitalization-weighted index of 500 stocks designed to measure performance of the broad domestic economy through changes in the aggregate market value of 500 stocks representing all major industries.
The PE ratio (price-to-earnings ratio) is a measure of the price paid for a share relative to the annual net income or profit earned by the firm per share. It is a financial ratio used for valuation: a higher PE ratio means that investors are paying more for each unit of net income, so the stock is more expensive compared to one with lower PE ratio.
Earnings per share (EPS) is the portion of a company’s profit allocated to each outstanding share of common stock. EPS serves as an indicator of a company’s profitability.
Earnings per share is generally considered to be the single most important variable in determining a share’s price. It is also a major component used to calculate the price-to-earnings valuation ratio.
All index data from FactSet.
This research material has been prepared by LPL Financial LLC.
Securities and advisory services offered through LPL Financial (LPL), a registered investment advisor and broker-dealer (member FINRA/SIPC). Insurance products are offered through LPL or its licensed affiliates. To the extent you are receiving investment advice from a separately registered independent investment advisor that is not an LPL affiliate, please note LPL makes no representation with respect to such entity.
Not Insured by FDIC/NCUA or Any Other Government Agency
Not Bank/Credit Union Guaranteed
Not Bank/Credit Union Deposits or Obligations
May Lose Value
RES-1513785-0423 | For Public Use | Tracking # 1-05370362 (Exp. 5/2024)
For a list of descriptions of the indexes referenced in this publication, please visit our website at lplresearch.com/definitions.
Ocean City Financial Group
Mark R. Reimet CFP®
801 ASBURY AVENUE
SUITE 650
OCEAN CITY, NJ 08226
609-814-1100 Office
[email protected]
OceanCityFinancialGroup.com
Securities and advisory services offered through LPL Financial, a registered investment advisor, Member FINRA/SIPC. LPL Financial and Ocean City Financial Group are separate entities.
IMPORTANT DISCLOSURES
This material is for general information only and is not intended to provide specific advice or recommendations for any individual. There is no assurance that the views or strategies discussed are suitable for all investors or will yield positive outcomes. Investing involves risks including possible loss of principal. Any economic forecasts set forth may not develop as predicted and are subject to change.
References to markets, asset classes, and sectors are generally regarding the corresponding market index. Indexes are unmanaged statistical composites and cannot be invested into directly. Index performance is not indicative of the performance of any investment and does not reflect fees, expenses, or sales charges. All performance referenced is historical and is no guarantee of future results.
Any company names noted herein are for educational purposes only and not an indication of trading intent or a solicitation of their products or services. LPL Financial doesn’t provide research on individual equities.
All information is believed to be from reliable sources; however, LPL Financial makes no representation as to its completeness or accuracy.
U.S. Treasuries may be considered “safe haven” investments but do carry some degree of risk including interest rate, credit, and market risk. Bonds are subject to market and interest rate risk if sold prior to maturity. Bond values will decline as interest rates rise and bonds are subject to availability and change in price.
The Standard & Poor’s 500 Index (S&P500) is a capitalization-weighted index of 500 stocks designed to measure performance of the broad domestic economy through changes in the aggregate market value of 500 stocks representing all major industries.
The PE ratio (price-to-earnings ratio) is a measure of the price paid for a share relative to the annual net income or profit earned by the firm per share. It is a financial ratio used for valuation: a higher PE ratio means that investors are paying more for each unit of net income, so the stock is more expensive compared to one with lower PE ratio.
Earnings per share (EPS) is the portion of a company’s profit allocated to each outstanding share of common stock. EPS serves as an indicator of a company’s profitability.
Earnings per share is generally considered to be the single most important variable in determining a share’s price. It is also a major component used to calculate the price-to-earnings valuation ratio.
All index data from FactSet.
This research material has been prepared by LPL Financial LLC.
Securities and advisory services offered through LPL Financial (LPL), a registered investment advisor and broker-dealer (member FINRA/SIPC). Insurance products are offered through LPL or its licensed affiliates. To the extent you are receiving investment advice from a separately registered independent investment advisor that is not an LPL affiliate, please note LPL makes no representation with respect to such entity.
Not Insured by FDIC/NCUA or Any Other Government Agency
Not Bank/Credit Union Guaranteed
Not Bank/Credit Union Deposits or Obligations
May Lose Value
RES-1513785-0423 | For Public Use | Tracking # 1-05370362 (Exp. 5/2024)
For a list of descriptions of the indexes referenced in this publication, please visit our website at lplresearch.com/definitions.


