
To Learn More, Be Sure to Visit - oceancityfinancialgroup.com
Jeffrey Buchbinder, CFA, Chief Equity Strategist Adam Turnquist, CMT, Chief Technical Strategist Stocks have had a nice run, but at higher prices, the bar for further gains gets higher. We have recently made the case in this publication that there are a lot of reasons to expect the market to go higher between now and year end. But with stocks at higher valuations, high-quality bonds offering attractive yields, an S&P 500 Index with concentrated leadership facing technical resistance at 4,300, and an elevated risk of a late-2023 recession, we think it makes sense to be a bit careful here. Importantly, though, neutral is not bearish.
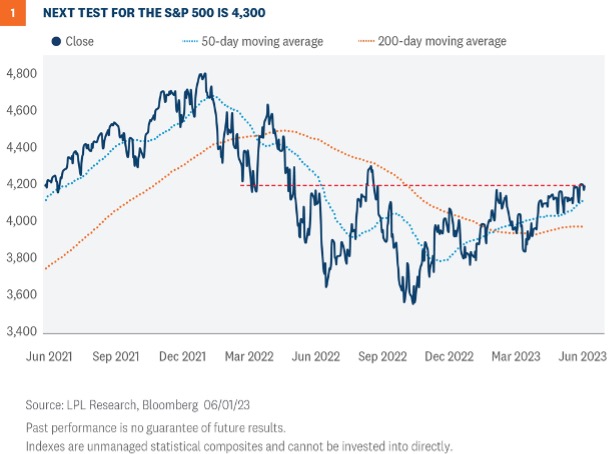 The bad news is that the next major area of resistance sets up near 4,300, which traces back to the August 2022 highs and lines up with a key retracement level of last year’s bear market. With major resistance coming into play only marginally above current S&P 500 levels, we believe the reward-to-risk profile has become less attractive.
Diverging market breadth represents the ugly portion of the technical story. Fewer and fewer stocks are participating in the latest advance, while leadership is highly concentrated in only a handful of mega-cap names. For example, only 43% of S&P 500 stocks are trading above their 200-dma, compared to 79% when the market notched its February high. On an equal weighted basis—meaning every stock in the index carries the same weighting—the S&P 500 is only 1.5% higher on the year, highlighting how much heavy lifting the mega-caps have done for the index’s 11.5% year-to-date advance (as of June 2).
In a typical bull market or even a developing one, widespread participation provides confirmation of the uptrend’s strength and sustainability. When participation in the advance is limited, vulnerabilities emerge as the weight of the market’s advance falls on the shoulders of a limited number of stocks.
The bad news is that the next major area of resistance sets up near 4,300, which traces back to the August 2022 highs and lines up with a key retracement level of last year’s bear market. With major resistance coming into play only marginally above current S&P 500 levels, we believe the reward-to-risk profile has become less attractive.
Diverging market breadth represents the ugly portion of the technical story. Fewer and fewer stocks are participating in the latest advance, while leadership is highly concentrated in only a handful of mega-cap names. For example, only 43% of S&P 500 stocks are trading above their 200-dma, compared to 79% when the market notched its February high. On an equal weighted basis—meaning every stock in the index carries the same weighting—the S&P 500 is only 1.5% higher on the year, highlighting how much heavy lifting the mega-caps have done for the index’s 11.5% year-to-date advance (as of June 2).
In a typical bull market or even a developing one, widespread participation provides confirmation of the uptrend’s strength and sustainability. When participation in the advance is limited, vulnerabilities emerge as the weight of the market’s advance falls on the shoulders of a limited number of stocks.
 Reason #4: Fixed Income Yields Are More Competitive With Equities
 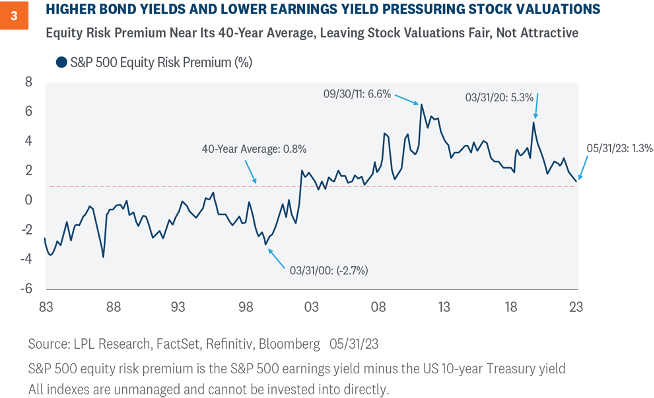 Based on the S&P 500 Index price and U.S. 10-Year Treasury yield as of May 31, the ERP is down to 1.3%, in line with the 40-year average and much richer than the near 3% ERP a year ago.
Friday’s strong jobs report increases the risk that interest rates move higher from current levels, as a potential July rate hike is back on the market’s radar. The increasing relative attractiveness of fixed income, coupled with fuller equity valuations, supported the STAAC’s decision to move to an overweight fixed income allocation and a neutral position on equities today.
Based on the S&P 500 Index price and U.S. 10-Year Treasury yield as of May 31, the ERP is down to 1.3%, in line with the 40-year average and much richer than the near 3% ERP a year ago.
Friday’s strong jobs report increases the risk that interest rates move higher from current levels, as a potential July rate hike is back on the market’s radar. The increasing relative attractiveness of fixed income, coupled with fuller equity valuations, supported the STAAC’s decision to move to an overweight fixed income allocation and a neutral position on equities today.
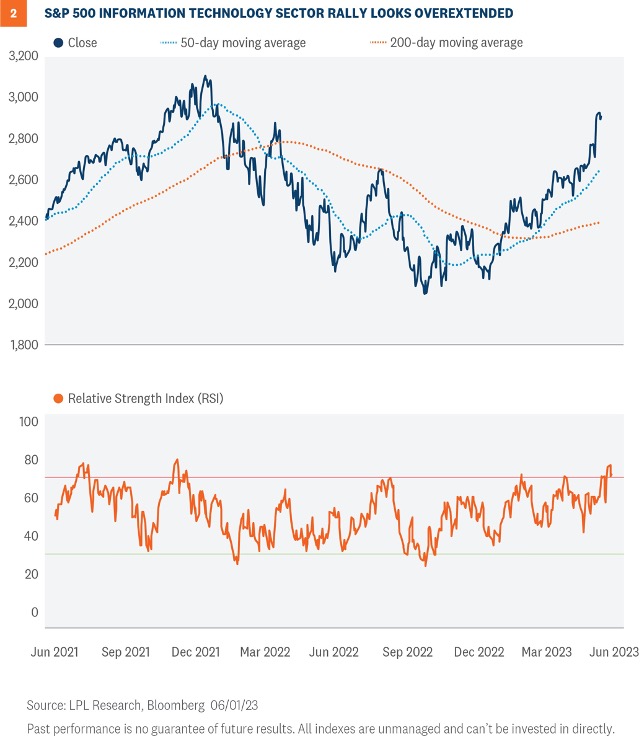
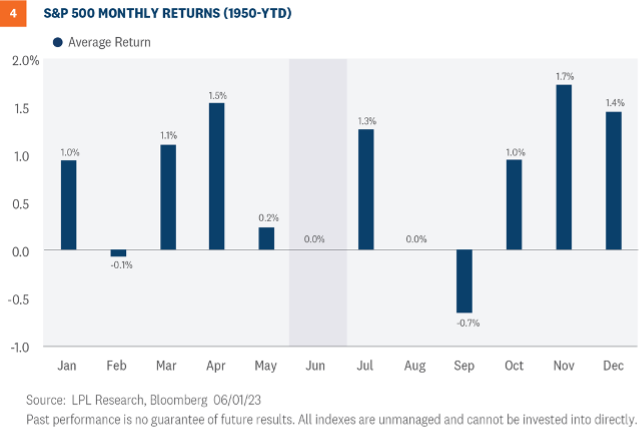 Furthermore, the index has only produced positive returns 54.8% of the time during June. For context, the S&P 500 has posted average monthly gains of 0.7% and finished positive 61% of the time for all months since 1950.
The seasonal setup for the technology sector in June is even worse. Since 1990, the sector has generated average and median price returns during the month of 0.0% and -1.7%, respectively, making it the second-worst month based on average returns and the worst month based on median returns. Furthermore, the tech sector has only produced positive returns 42.4% of the time during June, the lowest positivity rate across the calendar.
Furthermore, the index has only produced positive returns 54.8% of the time during June. For context, the S&P 500 has posted average monthly gains of 0.7% and finished positive 61% of the time for all months since 1950.
The seasonal setup for the technology sector in June is even worse. Since 1990, the sector has generated average and median price returns during the month of 0.0% and -1.7%, respectively, making it the second-worst month based on average returns and the worst month based on median returns. Furthermore, the tech sector has only produced positive returns 42.4% of the time during June, the lowest positivity rate across the calendar.
 Ocean City Financial Group
Mark R. Reimet CFP®
801 ASBURY AVENUE
SUITE 650
OCEAN CITY, NJ 08226
609-814-1100 Office
[email protected]
OceanCityFinancialGroup.com
Securities and advisory services offered through LPL Financial, a registered investment advisor, Member FINRA/SIPC. LPL Financial and Ocean City Financial Group are separate entities.
IMPORTANT DISCLOSURES
This material is for general information only and is not intended to provide specific advice or recommendations for any individual. There is no assurance that the views or strategies discussed are suitable for all investors or will yield positive outcomes. Investing involves risks including possible loss of principal. Any economic forecasts set forth may not develop as predicted and are subject to change.
References to markets, asset classes, and sectors are generally regarding the corresponding market index. Indexes are unmanaged statistical composites and cannot be invested into directly. Index performance is not indicative of the performance of any investment and does not reflect fees, expenses, or sales charges. All performance referenced is historical and is no guarantee of future results.
Any company names noted herein are for educational purposes only and not an indication of trading intent or a solicitation of their products or services. LPL Financial doesn’t provide research on individual equities.
All information is believed to be from reliable sources; however, LPL Financial makes no representation as to its completeness or accuracy.
U.S. Treasuries may be considered “safe haven” investments but do carry some degree of risk including interest rate, credit, and market risk. Bonds are subject to market and interest rate risk if sold prior to maturity. Bond values will decline as interest rates rise and bonds are subject to availability and change in price.
The Standard & Poor’s 500 Index (S&P500) is a capitalization-weighted index of 500 stocks designed to measure performance of the broad domestic economy through changes in the aggregate market value of 500 stocks representing all major industries.
The PE ratio (price-to-earnings ratio) is a measure of the price paid for a share relative to the annual net income or profit earned by the firm per share. It is a financial ratio used for valuation: a higher PE ratio means that investors are paying more for each unit of net income, so the stock is more expensive compared to one with lower PE ratio.
Earnings per share (EPS) is the portion of a company’s profit allocated to each outstanding share of common stock. EPS serves as an indicator of a company’s profitability.
Earnings per share is generally considered to be the single most important variable in determining a share’s price. It is also a major component used to calculate the price-to-earnings valuation ratio.
All index data from FactSet.
This research material has been prepared by LPL Financial LLC.
Securities and advisory services offered through LPL Financial (LPL), a registered investment advisor and broker-dealer (member FINRA/SIPC). Insurance products are offered through LPL or its licensed affiliates. To the extent you are receiving investment advice from a separately registered independent investment advisor that is not an LPL affiliate, please note LPL makes no representation with respect to such entity.
Not Insured by FDIC/NCUA or Any Other Government Agency
Not Bank/Credit Union Guaranteed
Not Bank/Credit Union Deposits or Obligations
May Lose Value
RES-1547550-0523 | For Public Use | Tracking # 1-05372350 (Exp. 06/2024)
For a list of descriptions of the indexes referenced in this publication, please visit our website at lplresearch.com/definitions.
Ocean City Financial Group
Mark R. Reimet CFP®
801 ASBURY AVENUE
SUITE 650
OCEAN CITY, NJ 08226
609-814-1100 Office
[email protected]
OceanCityFinancialGroup.com
Securities and advisory services offered through LPL Financial, a registered investment advisor, Member FINRA/SIPC. LPL Financial and Ocean City Financial Group are separate entities.
IMPORTANT DISCLOSURES
This material is for general information only and is not intended to provide specific advice or recommendations for any individual. There is no assurance that the views or strategies discussed are suitable for all investors or will yield positive outcomes. Investing involves risks including possible loss of principal. Any economic forecasts set forth may not develop as predicted and are subject to change.
References to markets, asset classes, and sectors are generally regarding the corresponding market index. Indexes are unmanaged statistical composites and cannot be invested into directly. Index performance is not indicative of the performance of any investment and does not reflect fees, expenses, or sales charges. All performance referenced is historical and is no guarantee of future results.
Any company names noted herein are for educational purposes only and not an indication of trading intent or a solicitation of their products or services. LPL Financial doesn’t provide research on individual equities.
All information is believed to be from reliable sources; however, LPL Financial makes no representation as to its completeness or accuracy.
U.S. Treasuries may be considered “safe haven” investments but do carry some degree of risk including interest rate, credit, and market risk. Bonds are subject to market and interest rate risk if sold prior to maturity. Bond values will decline as interest rates rise and bonds are subject to availability and change in price.
The Standard & Poor’s 500 Index (S&P500) is a capitalization-weighted index of 500 stocks designed to measure performance of the broad domestic economy through changes in the aggregate market value of 500 stocks representing all major industries.
The PE ratio (price-to-earnings ratio) is a measure of the price paid for a share relative to the annual net income or profit earned by the firm per share. It is a financial ratio used for valuation: a higher PE ratio means that investors are paying more for each unit of net income, so the stock is more expensive compared to one with lower PE ratio.
Earnings per share (EPS) is the portion of a company’s profit allocated to each outstanding share of common stock. EPS serves as an indicator of a company’s profitability.
Earnings per share is generally considered to be the single most important variable in determining a share’s price. It is also a major component used to calculate the price-to-earnings valuation ratio.
All index data from FactSet.
This research material has been prepared by LPL Financial LLC.
Securities and advisory services offered through LPL Financial (LPL), a registered investment advisor and broker-dealer (member FINRA/SIPC). Insurance products are offered through LPL or its licensed affiliates. To the extent you are receiving investment advice from a separately registered independent investment advisor that is not an LPL affiliate, please note LPL makes no representation with respect to such entity.
Not Insured by FDIC/NCUA or Any Other Government Agency
Not Bank/Credit Union Guaranteed
Not Bank/Credit Union Deposits or Obligations
May Lose Value
RES-1547550-0523 | For Public Use | Tracking # 1-05372350 (Exp. 06/2024)
For a list of descriptions of the indexes referenced in this publication, please visit our website at lplresearch.com/definitions.


