
To Learn More, Be Sure to Visit - oceancityfinancialgroup.com
Adam Turnquist, CMT, Chief Technical Strategist, LPL Financial Barry Gilbert, PhD, CFA, Asset Allocation Strategist, LPL Financial Despite the S&P 500 Index starting December with five consecutive days of losses, we think December is down but not out. December often starts slow but historically has been a strong month. There are also some potentially supportive seasonal patterns ahead, such as the Santa Claus Rally, the outlook for January following down years, and the third year of the presidential cycle. ‘Tis the season, and this week LPL Research looks at some important seasonal patterns as the year winds down.
SLOW START TO DECEMBER NOT YET BUCKING THE POSITIVE SEASONAL PATTERN
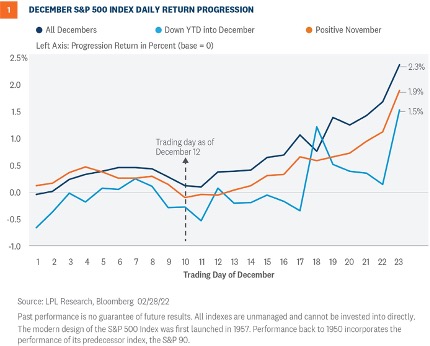
December is off to a rough start, and so far it’s not living up to its seasonal reputation of being one of the best months for equity market returns. Since 1950, the S&P 500 has historically produced average returns of just over 1.5% and has finished the month in positive territory 75% of the time. While the index is down as of Friday, December 9, seasonality trends point to a potential second-half recovery during the month.
As seen in Figure 1, despite the positive seasonal pattern, it’s not unusual for December to get off to a slow start. In fact, we’re near the low point for the historical pattern, and most gains have typically taken place in the second half of the month, although there’s a lot of variation from year to year.
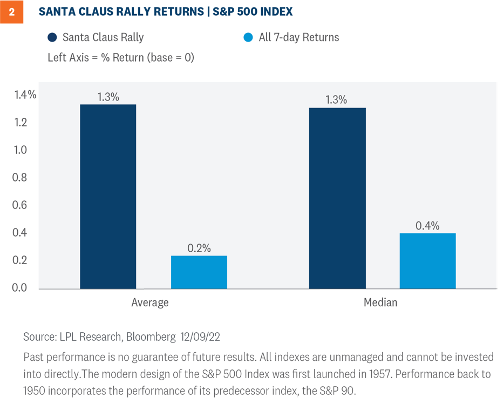
Despite the S&P 500 Index starting December with five consecutive days of losses, we think December is down but not out. December often starts slow but historically has been a strong month. There are also some potentially supportive seasonal patterns ahead, such as the Santa Claus Rally, the outlook for January following down years, and the third year of the presidential cycle. ‘Tis the season, and this week LPL Research looks at some important seasonal patterns as the year winds down.
SLOW START TO DECEMBER NOT YET BUCKING THE POSITIVE SEASONAL PATTERN
December is off to a rough start, and so far it’s not living up to its seasonal reputation of being one of the best months for equity market returns. Since 1950, the S&P 500 has historically produced average returns of just over 1.5% and has finished the month in positive territory 75% of the time. While the index is down as of Friday, December 9, seasonality trends point to a potential second-half recovery during the month.
As seen in Figure 1, despite the positive seasonal pattern, it’s not unusual for December to get off to a slow start. In fact, we’re near the low point for the historical pattern, and most gains have typically taken place in the second half of the month, although there’s a lot of variation from year to year.
 HOW SEASONALITY SETS UP FOR 2023
In the near term, of course, we’re not just thinking about the rest of December—January and potential returns for all of 2023 are also front of mind. Here are some forward-looking patterns we’re paying attention to:
HOW SEASONALITY SETS UP FOR 2023
In the near term, of course, we’re not just thinking about the rest of December—January and potential returns for all of 2023 are also front of mind. Here are some forward-looking patterns we’re paying attention to:
 AN EARLY HAPPY NEW YEAR
We’re now in the homestretch of 2022. It’s been a challenging year for both stocks and bonds as inflation soared, interest rates climbed, and the Federal Reserve executed one of its most aggressive rate hike campaigns on record. Ultimately, the economy, earnings, and the policy environment drive stock returns, not seasonal factors, but seasonals provide an important backdrop. And right now, the outlook based solely on seasonals is about as supportive is it gets (For our broader market view of 2023, see our Outlook 2023: Finding Balance). But even if only a potential small tailwind, we hope the seasonal outlook helps us put a rough year behind us and gives us reason to say an early Happy New Year.
AN EARLY HAPPY NEW YEAR
We’re now in the homestretch of 2022. It’s been a challenging year for both stocks and bonds as inflation soared, interest rates climbed, and the Federal Reserve executed one of its most aggressive rate hike campaigns on record. Ultimately, the economy, earnings, and the policy environment drive stock returns, not seasonal factors, but seasonals provide an important backdrop. And right now, the outlook based solely on seasonals is about as supportive is it gets (For our broader market view of 2023, see our Outlook 2023: Finding Balance). But even if only a potential small tailwind, we hope the seasonal outlook helps us put a rough year behind us and gives us reason to say an early Happy New Year.
 Ocean City Financial Group
Mark R. Reimet CFP®
801 ASBURY AVENUE
SUITE 650
OCEAN CITY, NJ 08226
609-814-1100 Office
[email protected]
OceanCityFinancialGroup.com
Securities and advisory services offered through LPL Financial, a registered investment advisor, Member FINRA/SIPC. LPL Financial and Ocean City Financial Group are separate entities.
IMPORTANT DISCLOSURES
This material is for general information only and is not intended to provide specific advice or recommendations for any individual. There is no assurance that the views or strategies discussed are suitable for all investors or will yield positive outcomes. Investing involves risks including possible loss of principal. Any economic forecasts set forth may not develop as predicted and are subject to change.
References to markets, asset classes, and sectors are generally regarding the corresponding market index. Indexes are unmanaged statistical composites and cannot be invested into directly. Index performance is not indicative of the performance of any investment and does not reflect fees, expenses, or sales charges. All performance referenced is historical and is no guarantee of future results.
Any company names noted herein are for educational purposes only and not an indication of trading intent or a solicitation of their products or services. LPL Financial doesn’t provide research on individual equities.
All information is believed to be from reliable sources; however, LPL Financial makes no representation as to its completeness or accuracy.
U.S. Treasuries may be considered “safe haven” investments but do carry some degree of risk including interest rate, credit, and market risk. Bonds are subject to market and interest rate risk if sold prior to maturity. Bond values will decline as interest rates rise and bonds are subject to availability and change in price.
The Standard & Poor’s 500 Index (S&P500) is a capitalization-weighted index of 500 stocks designed to measure performance of the broad domestic economy through changes in the aggregate market value of 500 stocks representing all major industries.
The PE ratio (price-to-earnings ratio) is a measure of the price paid for a share relative to the annual net income or profit earned by the firm per share. It is a financial ratio used for valuation: a higher PE ratio means that investors are paying more for each unit of net income, so the stock is more expensive compared to one with lower PE ratio.
Earnings per share (EPS) is the portion of a company’s profit allocated to each outstanding share of common stock. EPS serves as an indicator of a company’s profitability.
Earnings per share is generally considered to be the single most important variable in determining a share’s price. It is also a major component used to calculate the price-to-earnings valuation ratio.
All index data from FactSet.
This research material has been prepared by LPL Financial LLC.
Securities and advisory services offered through LPL Financial (LPL), a registered investment advisor and broker-dealer (member FINRA/SIPC). Insurance products are offered through LPL or its licensed affiliates. To the extent you are receiving investment advice from a separately registered independent investment advisor that is not an LPL affiliate, please note LPL makes no representation with respect to such entity.
Not Insured by FDIC/NCUA or Any Other Government Agency
Not Bank/Credit Union Guaranteed
Not Bank/Credit Union Deposits or Obligations
May Lose Value
RES-1356800-1222 | For Public Use | Tracking # 1-05350987 (Exp. 12/2023)
For a list of descriptions of the indexes referenced in this publication, please visit our website at lplresearch.com/definitions.
Ocean City Financial Group
Mark R. Reimet CFP®
801 ASBURY AVENUE
SUITE 650
OCEAN CITY, NJ 08226
609-814-1100 Office
[email protected]
OceanCityFinancialGroup.com
Securities and advisory services offered through LPL Financial, a registered investment advisor, Member FINRA/SIPC. LPL Financial and Ocean City Financial Group are separate entities.
IMPORTANT DISCLOSURES
This material is for general information only and is not intended to provide specific advice or recommendations for any individual. There is no assurance that the views or strategies discussed are suitable for all investors or will yield positive outcomes. Investing involves risks including possible loss of principal. Any economic forecasts set forth may not develop as predicted and are subject to change.
References to markets, asset classes, and sectors are generally regarding the corresponding market index. Indexes are unmanaged statistical composites and cannot be invested into directly. Index performance is not indicative of the performance of any investment and does not reflect fees, expenses, or sales charges. All performance referenced is historical and is no guarantee of future results.
Any company names noted herein are for educational purposes only and not an indication of trading intent or a solicitation of their products or services. LPL Financial doesn’t provide research on individual equities.
All information is believed to be from reliable sources; however, LPL Financial makes no representation as to its completeness or accuracy.
U.S. Treasuries may be considered “safe haven” investments but do carry some degree of risk including interest rate, credit, and market risk. Bonds are subject to market and interest rate risk if sold prior to maturity. Bond values will decline as interest rates rise and bonds are subject to availability and change in price.
The Standard & Poor’s 500 Index (S&P500) is a capitalization-weighted index of 500 stocks designed to measure performance of the broad domestic economy through changes in the aggregate market value of 500 stocks representing all major industries.
The PE ratio (price-to-earnings ratio) is a measure of the price paid for a share relative to the annual net income or profit earned by the firm per share. It is a financial ratio used for valuation: a higher PE ratio means that investors are paying more for each unit of net income, so the stock is more expensive compared to one with lower PE ratio.
Earnings per share (EPS) is the portion of a company’s profit allocated to each outstanding share of common stock. EPS serves as an indicator of a company’s profitability.
Earnings per share is generally considered to be the single most important variable in determining a share’s price. It is also a major component used to calculate the price-to-earnings valuation ratio.
All index data from FactSet.
This research material has been prepared by LPL Financial LLC.
Securities and advisory services offered through LPL Financial (LPL), a registered investment advisor and broker-dealer (member FINRA/SIPC). Insurance products are offered through LPL or its licensed affiliates. To the extent you are receiving investment advice from a separately registered independent investment advisor that is not an LPL affiliate, please note LPL makes no representation with respect to such entity.
Not Insured by FDIC/NCUA or Any Other Government Agency
Not Bank/Credit Union Guaranteed
Not Bank/Credit Union Deposits or Obligations
May Lose Value
RES-1356800-1222 | For Public Use | Tracking # 1-05350987 (Exp. 12/2023)
For a list of descriptions of the indexes referenced in this publication, please visit our website at lplresearch.com/definitions.


